2023 - horizontal white fair-start-movement most effective tagline
U
Q

What is it you're looking for?

Having Kids recently surveyed 376 people regarding their understanding of family size and population growth.

  • A significant number of people correctly see a relationship between family size and human population. About 86% of respondents answered affirmatively when asked whether there is a relationship between the number of children a couple decides to have and human population.
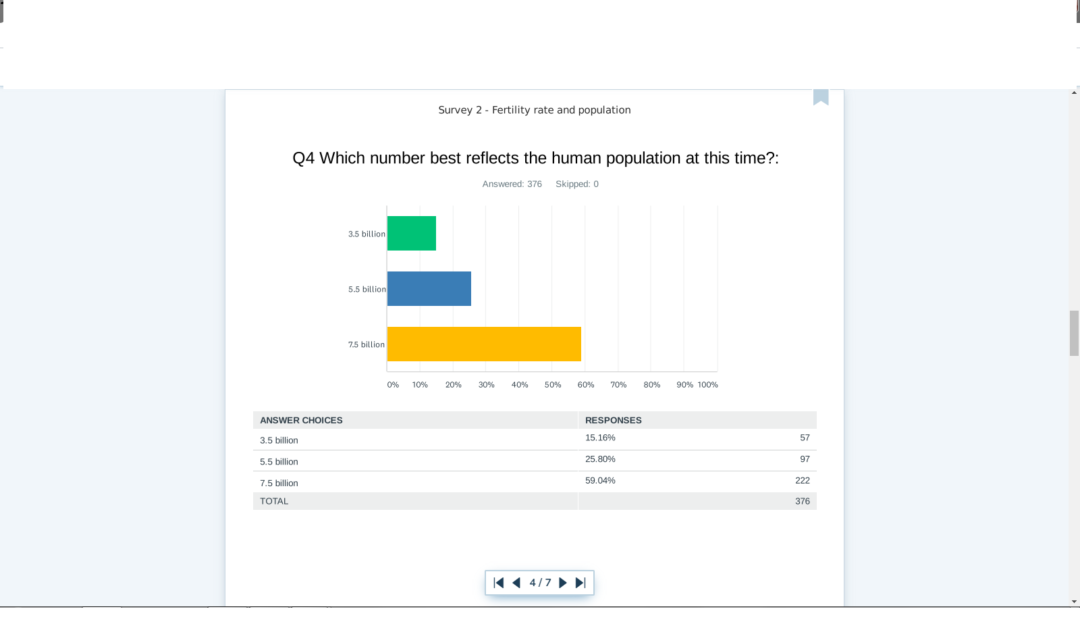
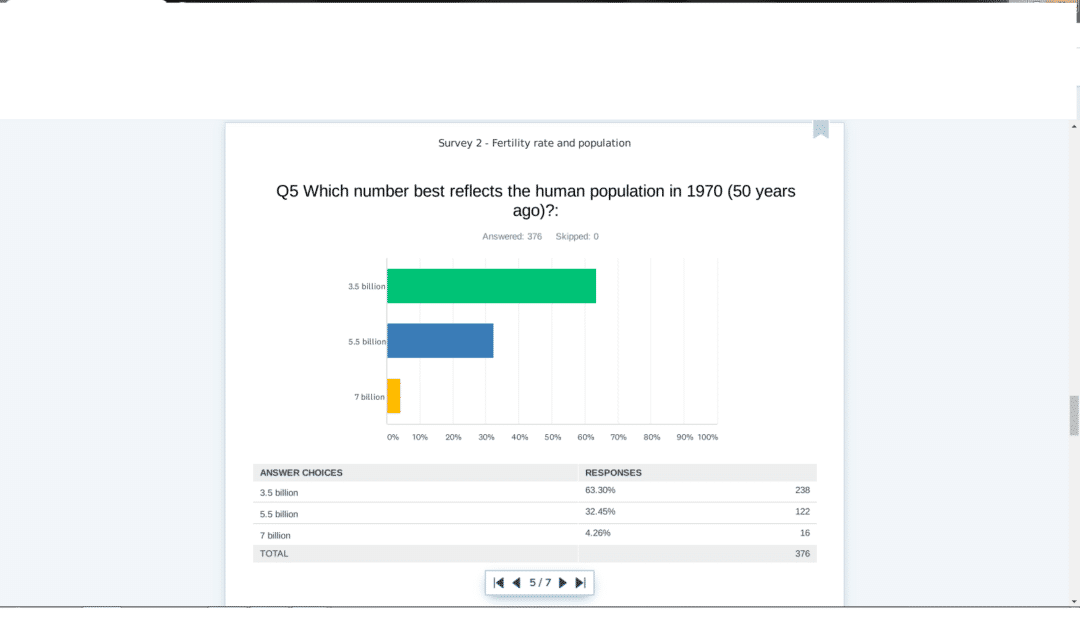
  • Though a majority of respondents have an accurate picture of current population numbers and those 50 years ago, a notable minority do not. Forty-one percent of respondents think the current number of people on the planet is either 3.5 billion (15.25%) or 5.5 billion (25.8%) instead of the correct answer of 7.5 billion and that the population in 1970 was either 7 billion (4.3%) or 5.5 billion (32.6%) instead of the correct answer of 3.5 billion.
  • Support for Having Kids’ mission remains high. Seventy-two percent of respondents indicated they would be supportive (36.3%) or very supportive (35.4%) of an organization pursuing Having Kids’ mission.
  • More education is needed regarding both the current population numbers and the expected growth of these numbers.
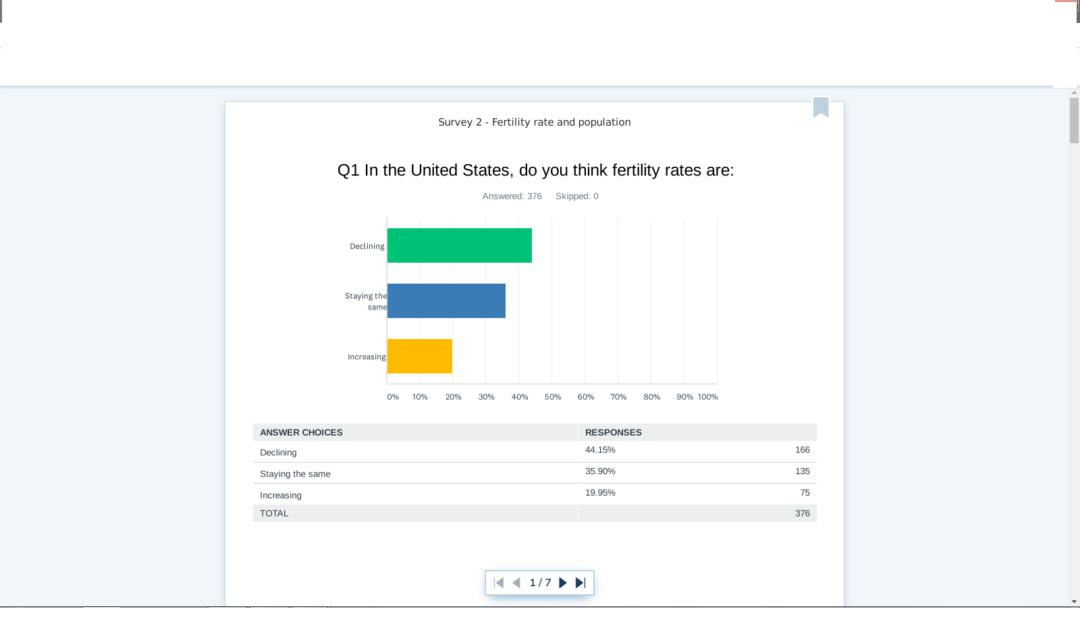
A survey chart shows U.S. opinions on fertility rates: 45.94% think rates are declining, 35.99% say staying the same, and 18.08% say increasing. Bar graph and response table are displayed.
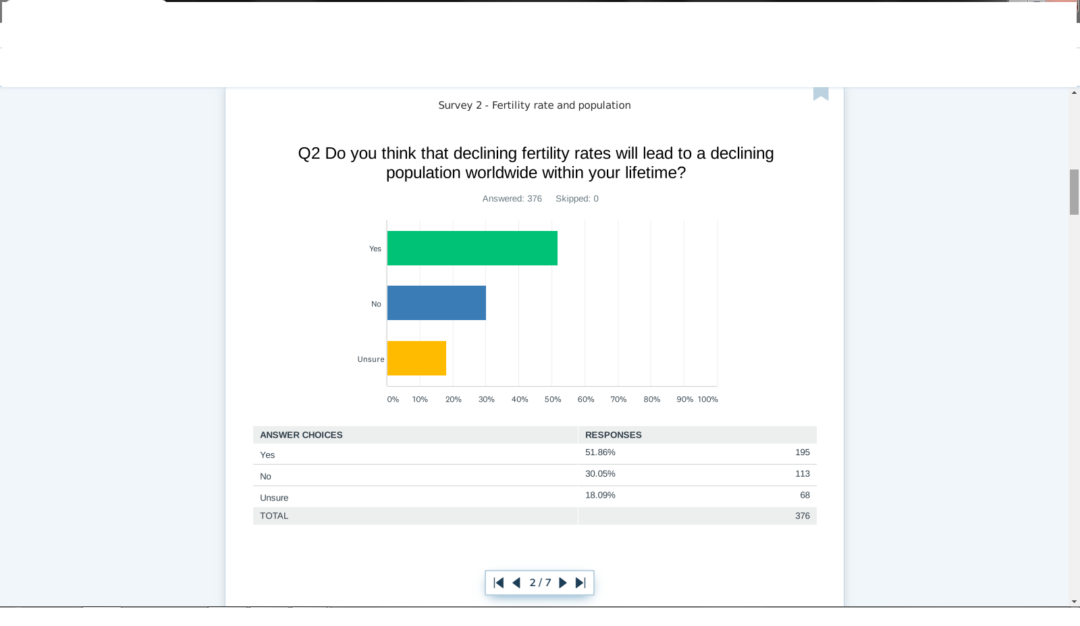
A survey question asks if declining fertility rates will cause a worldwide population decline within respondents lifetimes. Bar chart: Yes (166), No (53), Unsure (77). Table repeats responses. Total: 296 answered, 0 skipped.
A survey result screen shows a bar graph and table. The question asks about a relationship between family size and human population. 323 answered Yes, 25 No, and 28 Unsure, out of 376 total responses.
A survey graph showing responses to Which number best reflects the human population at this time? Most respondents chose 7.5 billion, followed by 6.5 billion and 3.5 billion; results are also shown in a table below the chart.
A survey question asks about the human population in 1970. A bar graph shows most respondents (62.63%) chose 3.5 billion, 28.29% chose 5.5 billion, and 9.08% chose 7 billion. Total responses: 381.
A survey results chart shows support levels for an organization promoting cooperation between prospective parents. Most respondents are very supportive or supportive, with fewer neutral or unsupportive responses.
Share This